Table of Contents
Introduction
This work attempts to create a framework for making good architectural decisions when faced with data challenges. A systematic way of approaching Big Data complex projects.
The document follows an architectural blueprint in order to classify the correct components in the Big Data architecture landscape. We can think in this blueprint as a way of standardize the names and roles of the different technologies used in an end-to-end Big Data project.
When Big Data projects reach a certain point, the should be agile and adaptable systems that can be easily modified, that requires to have a fair understanding of the software stack as a whole. This work try to help in the decision of which components to use thinking in his own areas of focus.
Many of the ideas, classifications and descriptions are based on other authors. I’ve paraphrased many of the sentences or entire paragraphs, because of I have not found a better way to express the ideas. At the end of this document I’ve posted the references per author.
What is Big Data
First of all, my favorite sentences describing what is Big Data, the first one the traditional Gartner definition.
Gartner’s 2012 definition “3Vs” model for describing big data:
Big Data is high VOLUME, high VELOCITY, and/or high VARIETY information assets that require new forms of processing to enable enhanced decision making, insight discovery and process optimization.
Big Data and open source movement:
Big data refers to the process of approaching the value of data (lot of data) in a new way. A new way driven for the open source movement.
Big Data and conventional methods:
Big Data is when the size of the data itself becomes part of the problem, so the data size becomes large enough that it cannot be processed using conventional methods.
Key Principles in Big Data Projects
For Big Data project success we have to take into account several key principles to keep in mind.
Trade-offs
Finding efficient solutions to data challenges means dealing with trade-offs. Some technologies that are optimized for a specific data usage case are not the best choice for others. The best solutions combine technologies designed to tackle specific needs for each step in a data processing pipeline. A data pipeline requires the coordination of a collection of different technologies for different parts of a data life-cycle.
Build systems that scale
Scalability is the term we use to describe a system’s ability to cope with increased load. Even if a system is working reliably today, that doesn’t mean it will necessarily work reliably in future. We have to design the system thinking that the system can grow in different particular ways (and design the systems toward infinity).
Build systems that can share
Data pipelines may require data-transformation techniques and the use of specific formats designed for efficient sharing and interoperability. Think about strategies for sharing data, inter-systems and inter-humans.
Build solutions, not infrastructure
To use infrastructure as a service (cloud resources) should be considered the rule, not the exception. We have to use cloud services as a key building block for our solution. If our business requirements involve purchasing, installing and administering physical hardware could be a roadblock for our customer. Again we have to take trade-offs with the physical and virtual hardware for our solution.
Build value, not technology
Always keep in mind the business question that your data solution is meant to answer. The target of data intensive solutions is to get VALUE from data. In order to success in this rule, we have to articulate the business questions that your are trying to answer. Sometimes we don’t need Big Data techniques for answer this questions.
There is no obvious solution
Solving a data challenge today is a complex task. Open source software has helped large-scale data technology become more accessible, however current state-of-art of this technology ecosystem is evolving, and there are many overlapping projects in various states of maturity. Different data pipelines can solve the same problem, choosing one architecture over the other depends on a range of non-technical factors.
Make life easy for operations
Operations teams are vital to keeping a software system running smoothly. It’s specially important for Big Data projects built over multiple parts working together as a whole, to make it easy for operations teams, to make it easy for new engineers to understand the system, to make it easy for engineers in future to make changes to the system, adapting it for unanticipated use cases as requirements change.
Ensure reliability with resilience
Our system must continuing to work correctly, even when things go wrong. Note that a fault is not the same as a failure. A fault is usually defined as one component of the system deviating from its spec, whereas a failure is when the system as a whole stops providing the required service to the user. It is impossible to reduce the probability of a fault to zero; therefore it is usually best to design fault tolerance mechanisms that prevent faults from causing failures. Although we generally prefer tolerating faults over preventing faults.
The Framework
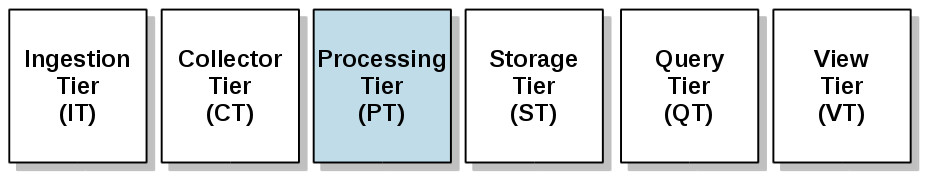
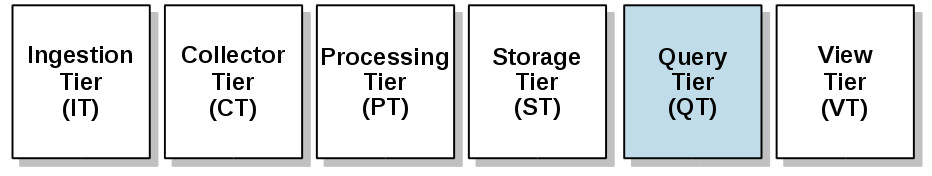
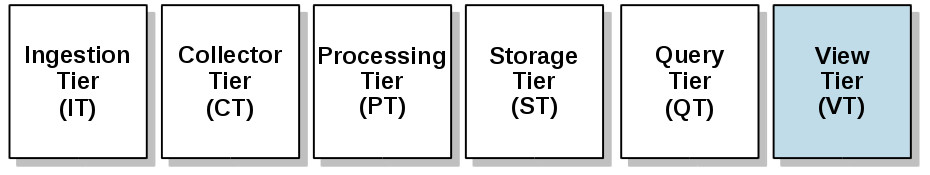
We are going to follow an architectural blueprint that allows us to talk about all Big Data systems in a generic way. Our framework. Our architecture is spitted into different tiers, keep in mind these are not hard rigid tiers that your project has to fit. It is a generic template where the components stack (building blocks) may be classified by functionality. This framework is a template for design data pipelines with different requirements: such as streaming systems with on-line analytic capabilities, or batch systems with off-line analytic requirements.
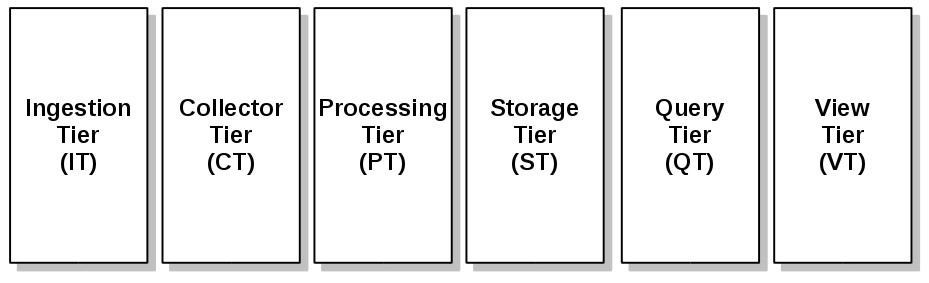
- Ingestion Tier (IT): This tier is where data comes into the system and starts its journey; from here it will progress through the rest of the system data pipeline.
- Collector Tier (CT): With this tier we decouple the components of the ingestion tier from our routing tier, where the analytic capabilities may begin.
- Processing Tier (PT): In this tier we route the data to different destination, classify the data flows and it’s the first point where the analytic may take place.
- Storage Tier (ST): This is the tier where the data pipeline is persisted for data access of query or analytic tools.
- Query Tier (QT): Where the interactive analytic takes place, where the frameworks for data analytic live. Here the data value is gathered for the next tier.
- View Tier (VT): The visualization, or presentation tier, probably the most important tier, where the data pipeline users may feel the VALUE of DATA.
The Ingestion Tier
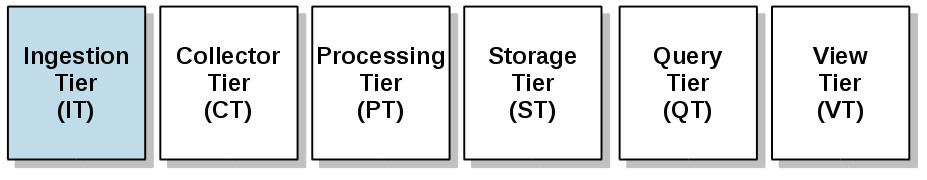
Data ingestion in a Big Data system is a hard task, once you get past the “playing around” phase with the data pipeline in a PoC, where the data injection probably is trivial, we have to planning the way to ingest data flows from thousand of sources into our Data Center.
In order to design a complete Data Ingestion Architecture and choose the right tools for it, we must attend to the following key principles:
| The network is slow | Sending data across a network is slow and data pipelines might compete with other business traffic. Often the network bandwidth is taken to the limit in big data pipelines challenge. We need tools with bandwidth throttling and compression capabilities. |
| The network is unreliable | The data ingestion pipeline often uses systems that are separated by data centers, continents, and data might travel through unreliable networks. The data pipeline must be resilient. |
| Heterogeneous sources | The tools for data ingestion pipelines must be ready for systems that use different data sources technologies, different operating systems. The tools must be easily extensible for on going changing data sources, and architecture independents. |
| Choose the right data format | The data ingestion task (data in motion) must be the most efficient as possible in terms of network usage. For provide efficient data transfers, it’s beneficial to represent data in the most compact way possible. The tools must provide data serialization formats capabilities. |
| Data immutability | Try to “log everything”, you don’t know witch information your data scientists could need in the future. Even the opposite approach is a good advise, try to enrich your log with probably useful information. |
| Streaming data | It’s time for thinking about your business necessities, the data pipeline is for streaming data (fast data) or your target is a batch processing storage. Maybe in the real world you have to deal with both approaches. The design of the data ingestion pipeline have to take this non-functional requirements in this early phase. |
IT – Data formats for Data in Motion
It’s time to take the firsts decisions about the data format in our data pipeline: Different types of users have different types of data consumer needs. Because you are planning on sharing a great deal of data, we need to think the users have to access the data in a meaningful way. Should you use the most compact format possible and make the data available for computer programmers or optimize the data for human readability? You probably need to provide a variety of formats for the various use cases you hope to support. In the early phase of data injection our focus is converting data into bits that a computer can understand and move from one place to another, this is the process known as data serialization.
The most common data serialization approaches in the Big Data scene are:
| Serialization format | Description |
| Apache Thrift | Thrift is a much bigger project than Avro or Protocol Buffers, as it’s not just a data serialization library, but also an entire RPC framework. It also has a somewhat different culture: whereas Avro and Protobuf standardize a single binary encoding, Thrift embraces a whole variety of different serialization formats (which it calls “protocols”). |
| Google Protocol Buffers | PB was designed to be layered over an (existing) RPC mechanism. You can use special generated source code to easily write and read your structured data to and from a variety of data streams and using a variety of languages. |
| Apache Avro | The more recent data serialization format that combines some of the best features o the previously listed. Avro data is self-describing and uses a JSON-schema description. This schema is included with the data itself, and natively support compression. Probably it may become a de facto standard for data serialization. |
IT – Three of the most widespread data ingestion tools
| Ingestion Tool | Description |
| Apache Flume | This tool was originally created by Coludera. was designed from the ground-up to tackle the problem of collect large streams of events from heterogeneous data sources in a straightforward, scalable, reliable way, and empirical results support the success of its approach. |
| Apache NiFi | This tool is a dataflow system based on the concepts of flow-based programming and was designed to manage dataflow in massive distributed computing systems operated by numerous teams and organizations. Because was originally open sourced by the National Security Agency (NSA), the security and the tracking of data flow from beginning to end is a core feature, among others such as powerful web-based user interface. |
| Elastic Logstash | Logstash is a tool for gather logging messages with powerful features and designed taking as foundation a easy-to-use approach. This tool is part of the Elastic ELK stack: A collector tool (Logstash) with visualization capabilities (Kibana) on top of search engine Lucene (ElasticSearch). |
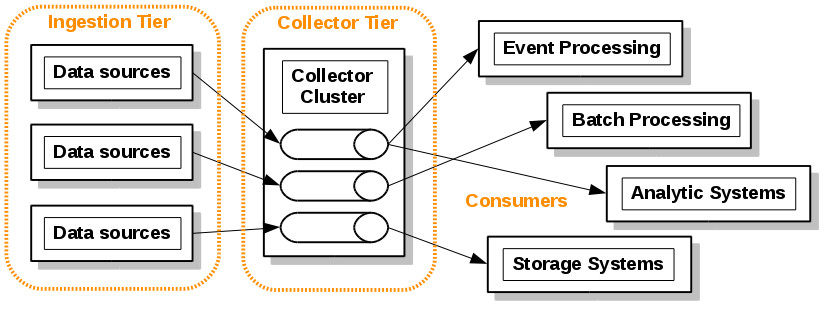
The Collector Tier
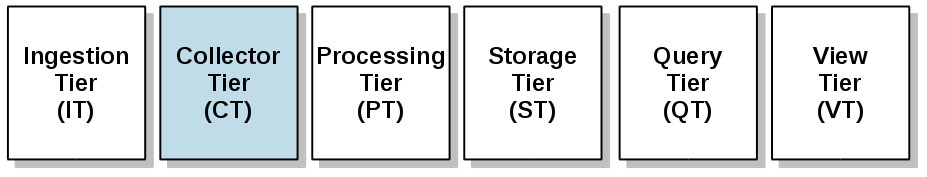
The collection tier in our framework is the classical conception of Mediation Pattern [GoF]: In this case we use a messaging system (message-queuing model) acts as a mediator between all of the programs that can send and receive messages. In this tier (CT) we are going to focus on transportation data from the ingestion tier (IT) to the rest of data pipeline.
The collection tier decouple the data producers pipeline from the processing or analytic layer (consumers) and we can work at a higher level of abstraction.
Beyond the proven “send and forget” approach using a MOM (Message-oriented middleware) we have a key tool in the Big Data ecosystem with special features for massive data streaming processing that overcome the classical usage of standard MOMs: Apache Kafka.
CT – Why Apache Kafka is a new approach in the MOMs scene
Probably the most disruptive feature in Apache Kafka is the “durable messaging” feature. It’s a message-queuing product that support offline consumers.
Kafka relies heavily on the filesystem for storing and caching messages: rather than maintain as much as possible in-memory and flush it all out to the filesystem in a panic when we run out of space, Kafka invert that. All data is immediately written to a persistent log on the filesystem without necessarily flushing to disk. In effect this just means that it is transferred into the kernel’s pagecache.
The persistent data structure used in messaging systems are often a per-consumer queue with an associated BTree or other general-purpose random access data structures to maintain metadata about messages. However Btree operations are O(log N). In Apache Kafka a persistent queue is built on simple reads and appends to files as is commonly the case with logging solutions. This structure has the advantage that all operations are O(1) and reads do not block writes or each other. So the performance is completely decoupled from the data size.
CT – Advantages of durable messaging
Having access to virtually unlimited disk space without any performance penalty means that Kafka can provide some features not usually found in a messaging system.
Kafka solve the situation where the producer (our ingestion tier) is generating messages faster then the consumer (our processing or analysis tier) can consume them in a reliable way. Even If your business case requires that you need to support offline consumers or want to make sure your producers and consumers can be completely decoupled, Kafka guarantee that without data loss.
In Kafka, instead of attempting to deleting messages as soon as they are consumed, we can retain messages for a relative long period. This leads to a great deal of flexibility for consumers,
The scalable persistence in Kafka allows for the possibility of consumers that only periodically consume such as batch data loads that periodically bulk-load data into an offline system such as Hadoop or a relational data warehouse.
An interesting architecture design that take advantage of this kind of durable messaging is the reprocessing concept at processing/analytic tier:
CT – Reprocessing approach
With massive durable messaging capabilities of Apache Kafka we get the agile development paradigm at stream processing layer. The stream processing traditional design is inappropriate for high-throughput processing of historical data. However we can reach reprocessing directly from our stream processing job with this simple approach:
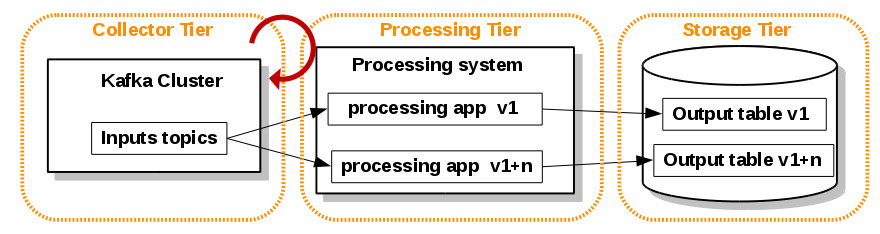
- Use Kafka or some other system that will let you retain the full log of the data you want to be able to reprocess and that allows for multiple subscribers. For example, if you want to reprocess up to 30 days of data, set your retention in Kafka to 30 days.
- When you want to do the reprocessing, start a second instance of your stream processing job that starts processing from the beginning of the retained data, but direct this output data to a new output table
- When the second job has caught up, switch the application to read from the new table.
- Stop the old version of the job, and delete the old output table.1
The Processing Tier
The last tier (collector tier) was designed to gather data from the collection tier and make it available to be moved through the rest of the data pipeline architecture. At this point the data is ready and waiting for us to consume and do magic with.
In this tier we route the data to different destinations, we classify the data flows. It’s the first point where a strong analytic might take place.
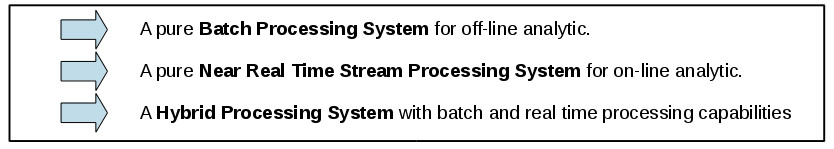
 At this point we have to take into account what kind of workload we need and begin to specialize our data pipeline processing system. We can to specialize our system in three kind of flavors:
PT – Ecosystem Tools
| Name | Target | Description |
| Linkedin Camus | Batch | The tools designed for batch download are MapReduce jobs for parallel Hadoop donwload. This tools is the Apache Kafka to Hadoop connector from Linkedin. This tool is in EOL state and it’s superseded by Linkedin Gobblin the new framework for Data Ingestion in Hadoop. A new API layer for this task is actively developed in Kafka community (KIP-26). |
| Apache Sqoop | Batch | As the former tool, it’s a MapReduce for batch download. It’s a tool designed for efficiently transferring bulk data between Apache Hadoop and structured datastores such as relational databases. |
| Apache Storm | RT | It’s a tuple-at-a-time distributed real-time computation system for processing large volumes of high-velocity data. Storm is extremely fast, with the ability to process over a million records per second per node on a cluster of modest size. This tools is designed for real-time analytic and might be included in the category of CEP systems. |
| Apache Samza | RT | It’s a distributed stream processing framework originally designed by Linkedin. It’s the real-time processing system used for Linkedin for processing topics from Apache Kafka. Apache Samza jobs process more than one million messages per-second in Linkedin deployment.s |
| Apache Spark | Hybrid | This tool is designed for stream processing with strong Machine Learning capabilities. This tool is able to apply the same analytic code in the stream data flow and over Hadoop file system for off-line analytic. |
| Apache Flink | Hybrid | This tool is specifically designed for for unifying flexible analytics in streaming and batch data sources. This tool compete against Apache Spark in the same sector. |
| Twitter Summingbird | Hybrid | It was the first attempt of unify a framework for real-time and batch processing. The logic is exactly the same, and the code is almost the same. The main difference is that you can execute the Summingbird program in “batch mode” (using Scalding), in “realtime mode” (using Apache Storm). |
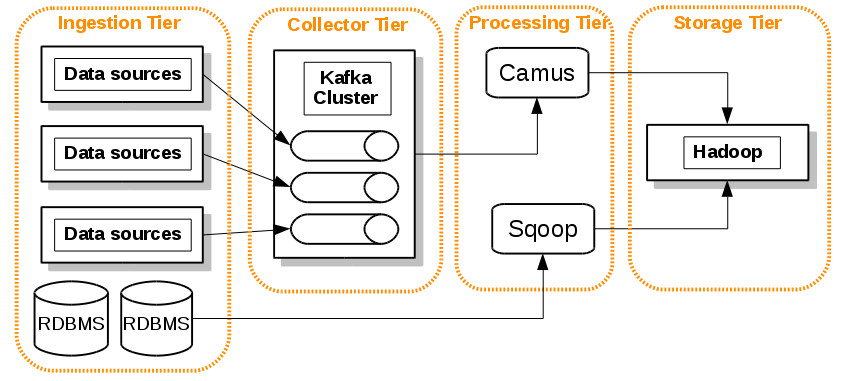
PT – Batch processing
A pure batch processing system for off-line analytic.
In this example we schedule two MapReduce jobs:
- Linkedin Camus for bulk Kafka topics donwloads from heterogeneous sources.
- Apache Sqoop for bulk RDBMS data transferring. In this pipeline we don’t use the collector tier for efficiency and for use rich features of Sqoop for DB transfer. Nevertheless we can maintain the source → kafka → camus – Hadoop pipelie for RDBMS too in our design
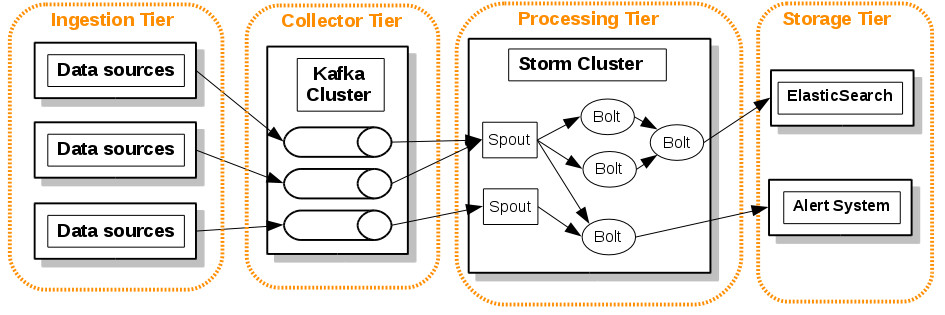
PT – Near Real Time processing
A pure online processing system for on-line analytic.
In this example we model a Near Real Time alert monitoring system:
- The Apache Storm cluster makes decisions about the criticality of the event and sends the alerts to the alert system (dashboard, e-mail, other monitoring systems …)
- Other route of this real time pipeline is processing all events and convert them to ElasticSearch indexes in order to show graphics in real time (with Kibana for example).
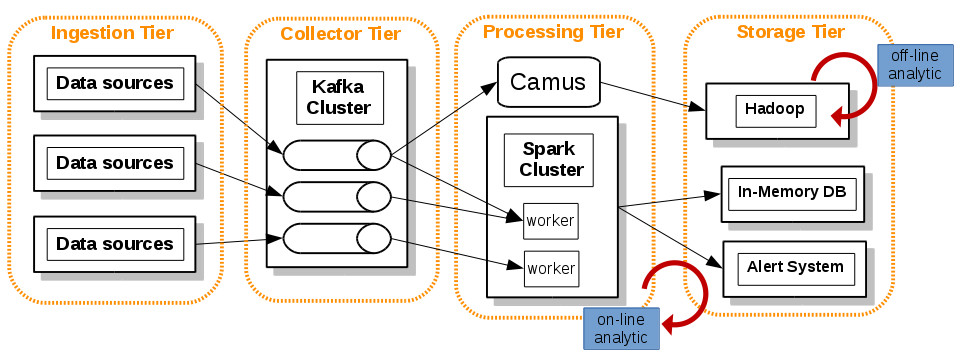
PT – Hybrid processing
This is an example of Hybrid processing system (a.k.a Lambda Architecture).
In this example we model a hybrid processing system:
- With Linkedin Camus we download periodically bulk data to Hadoop.
- With Apache Spark we can make complex analytic (with Machine Learning capabilities) in the streaming event flow (on-line analytic) and use the same code for off-line analytic on Hadoop batch system.
 The Storage Tier

The challenge in this tier is to keep data in the right place based on usage.
Relational Databases have been the correct, and successful place to store our data over years. With the new big data strategic enterprise applications you should no longer be assuming that your persistence should be relational. The relational option might be the right one – but you should seriously look at other alternatives.
A complex enterprise application uses different kinds of data, and needs usually integrates information from different sources. Such applications manage their own data using different technologies depending on how the data is used. This necessities introduce a new concept in the database world: the Polyglot Persistence.
Polyglot Persistence: Different kinds of data are best dealt with different data stores. In short, it means picking the right tool for the right use case. It’s the same idea behind Polyglot Programming, which is the idea that applications should be written in a mix of languages to take advantage of the fact that different languages are suitable for tackling different problems.
ST – From ACID to CAP Theorem
The relational database concept owes everything to the work of Edgar F. Codd. He laid the foundations for the transition of hierarchical database to relational.
As relational databases were brought to market. Codd was not completely satisfied with the design of various implementations, so he publish a set of rules that he believed must be met in order for a database to qualify as “relational”: The relational Database ACID Test.
ACID – Atomicity, Consistency, Isolation and Durability. Databases that generally conform to a relational model are designed with this four traits as target:
Atomicity and consistency: refer to relational databases goals of preventing partial intersections and to maintaining a valid state from transaction to another.
Isolation: refers to the ability of a database to handle multiple transactions at the same time without conflicts.
Durability: means that a database retains the last known correct state in the event of errors or crashes
On the other hand, with the growth of Web applications, pioneers such as Amazon and Google found that relational databases were not always the right tool for the job. Millions of users acceding to online systems need to handle systems at scale and the strict requirements of consistency are shifted to availability and performance.
When data sizes scale to very large volumes, data applications developers often have to deal with a variety of trade-offs. Those systems have to deal with distributed databases approaches. At this time UC Berkeley professor Dr. Eric Brewer proposed a model for understanding how distributed computing systems such as distributed database system might operate. Brewer’s conjecture begins by defining three important characteristics of distributed systems: CAP Theorem.
Consistency: refers to the ability for each machine to have access to exactly the same data at any given time.
Availability: describes the ability of system to respond to requests.
Partition tolerance: Finally, if a system can can function successfully in the event of partial failure (perhaps if one of the server in the system crashes or loses power), then the system exhibits partition tolerance.
Brewer’s famous conjecture stated that it is impossible for a distributed system to exhibit all three of these characteristics at the same time.
ST – From BASE to NoSQL
The consequences of the CAP theorem feed database designers to come up with alternative ways of thinking about scalability. The trend was an alternative to the rules of ACID compliance come to be known as BASE: Basically available, soft state, eventually consistent.
BASE systems strive to maximize some aspect of CAP, such as availability or partition tolerance, by allowing parts of the database system to exist in different states of consistency
These concepts provide the basis for the arrival of the new paradigm in databases: NoSQL databases.
NoSQL, “Not Only SQL”, refers to an increasingly group of non-relational databases designed for large-scale data storage and for massively data processing across a large number of (commodity) distributed servers horizontally scalable They also use non-SQL languages and mechanisms to interact with data.
ST – Classification NoSQL databases
The classification of NoSQL databases are based on general design concepts rather than strict categories, as features of one type are often found on the other. One of the most obvious shifts with NoSQL is a move away from the relational model. Each NoSQL solution has a different data model that it uses, which we put into four categories widely used in the NoSQL ecosystem: key-value, document, column-family, and graph.
The copcept of “aggregte”: The relational model takes the information that we want to store and divides it into tuples (rows). A tuple is a limited data structure: It captures a set of values, so you cannot nest one tuple within another to get nested records, nor can you put a list of values or tuples within another. Aggregate orientation takes a different approach. It recognizes that often, you want to operate on data in units that have a more complex structure than a set of tuples. It can be handy to think in terms of complex record that allows lists and other record structures to be nested inside it. key-value, document, and column-family databases all make use of this more complex record.
| Key-value Data Model | key-value is strongly aggregate-oriented. What we meant by this was that we think of these databases as primarily constructed through aggregates. These types of databases consist of lots of aggregates with each aggregate having a key or ID that’s used to get at the data. The design makes for very good performance for database writes. |
| Document Data Model | Also strongly aggregate-oriented approach. With a key-value store, we can only access an aggregate by lookup based on its key. With a document database, we can submit queries to the database based on the fields in the aggregate, we can retrieve part of the aggregate rather than the whole thing, and database can create indexes based on the contents of the aggregate. |
| Column-family Data Model | Perhaps the best way to think of the column-family model is as a two-level aggregate structure. As with key-value stores, the first key is often described as a row identifier, picking up the aggregate of interest. The difference with column-family structures is that this row aggregate is itself formed of a map of more detailed values. These second-level values are referred to as columns. As well as accessing the row as a whole, operations also allow picking out a particular column. |
| Graph Data Model | Most NoSQL databases were inspired by the need to run on clusters, which led to aggregate oriented data models of large records with simple connections. Graph databases are motivated by a different frustration with relational databases and thus have an opposite model: small records with complex interconnections. This kind of databases are specialized in search complex relations between entities at huge scale. |
ST – The newcomer NewSQL
The return of Codd: A collection of new database designs attempt to bring together features found in distributed nonrelational databases with the consistency guarantees afforded by relational designs (ACID). Some of these projects are known as “NewSQL” database designs.
A special mention of one of this NewSQL databases: VoltDB.
VoltDB was created in part by Michael Stonebraker, who was instrumental in the creation of popular PostgreSQL and the proprietary analytical database Vertica. VoltDB is a relational, ACID-compliant database that share some of the same performance boosts as Redis (a very fast key-value in-memory database). VoltDB uses an in-memory data model along with snapshots of the data to create persistence, and VoltDB is designed to scale easily by simply adding more servers to the system.
Prior to a Magic Quadrant report in 2014 Gartner kept separate the very mature OLTP market separately from NoSQL. However according to Gartner by 2017, all leading operational DBMSs will offer multiple data models, relational and NoSQL, in a single platform. This is because of the new trend towards NewSQL approaches.
The Query Tier
 This is the layer where strong analytic processing take place. This is a field where interactive queries are necessaries and it’s a zone traditionally dominated by SQL expert developers.
SQL will continue to be the lingua franca for all analytics and transactional database applications. Consequently, big data solution providers absolutely must allow SQL developers to transparently tap into the full range of big data platforms.
Big Data providers are making big efforts to standardize this layer, however today’s big data developers must wrangle with a plethora of SQL-like languages for big data access, query and manipulation
QT – SQL-like approaches
The SQL-like frameworks are overlapped with other general porpoise processing frameworks. The ultimate goal of these frameworks is to provide a higher-level interface than the low-level MapReduce framework provides. Probably the most high-level view is the well know SQL interface.
A bunch of these SQL-like frameworks works on Hadoop, these processing technologies fit in the category of SQL-on-Hadoop. Otherwise, there are processing frameworks that work on top of No-SQL databases, providing a pseudo-SQL interface to non-relational databases. The following is an attempt of classification of SQL approaches focused on target of the query engine.
| Batch SQL | These technologies are designed for batch queries on Hadoop by providing a declarative abstraction layer (SQL-like), which uses the MapReduce processing framework in the background. Are used primarily for queries on very large data sets and the queries can take anywhere between a few minutes to several hours depending on the complexity of the job. The dominant tool for this porpoise is Apache Hive with the SQL-like language HiveQL. An evolution of classical MapReduce (MRv2) in order to accelerate this kind of sql-on-hadoop is the Apache Tez initiative, with this new approach Apache Hive has as objective to deliver interactive query capabilities, the next category. |
| Interactive SQL | Those analytic tools were designed taken as base the speed up of the queries (low-latency). Tools such as Cloudera Impala or Apache Drill, open source versions of Google’s Dremel, have response times vary between milliseconds to minutes depending on the query complexity. Those technologies amins to support common BI tools such as Tableau and MicroStrategy for reporting and ad-hoc queries. |
| In-Memory Streaming SQL | In the processing tier (PT) we talk about in-memory processing (stream processing). This layer has SQL-like query capabilities too. Spark SQL is the Apache Spark approach to accelerate query processing at stream layer and batch layer (with an alternative execution engine to Apache Hive). |
| Operational SQL | Unlike batch and interactive queries that are used by business teams for decision making and operate as read-only operations on large datasets (OLAP), point queries are typically done by OLTP and web applications, operating over smaller datasets and typically include insert, update, and deletes. The expected latency is usually very low (e.g., milliseconds) due to the high volume of requests from these applications. This query engines run over NoSQL databases, such as Apache Hbase with Apache Phoenix connector, or Apache Cassandra with the built-in SQL-like language CQL. |
QT – Data Warehouse
In the early days of business data processing, a write to the database typically corresponded to a commercial transaction taking place. Even though databases started being used for many different kinds of data the basic access pattern remained similar to processing business transactions: records are inserted or updated based on the user’s input. Because these applications are interactive, the access pattern became known as online transaction processing (OLTP).
However, databases also started being increasingly used for data analytics, which has very different access patterns. Usually an analytic query needs to scan over a huge number of records, and calculates aggregate statistics, rather than returning the raw data to the user.
These queries are often written by business analysts, and feed into reports that help the management of a company make better decisions (business intelligence). In order to differentiate this pattern of using databases from transaction processing, it has been called online analytic processing (OLAP).
At first, the same databases were used for both transaction-processing and analytic queries. Nevertheless, there was a trend for companies to stop using their OLTP systems for analytics purposes, and to run the analytics on a separate database instead. This separate database was called a data warehouse:
The data warehouse contains a read-only copy of the data in all the various OLTP systems in the company (operational data). Data is extracted from OLTP databases (using either a periodic data dump or a continuous stream of updates) transformed into an analysis-friendly schema, cleaned up, and then loaded into the data warehouse (OLAP’s multidimensional data models). This process of getting data into the warehouse is known as Extract-Transform-Load (ETL)
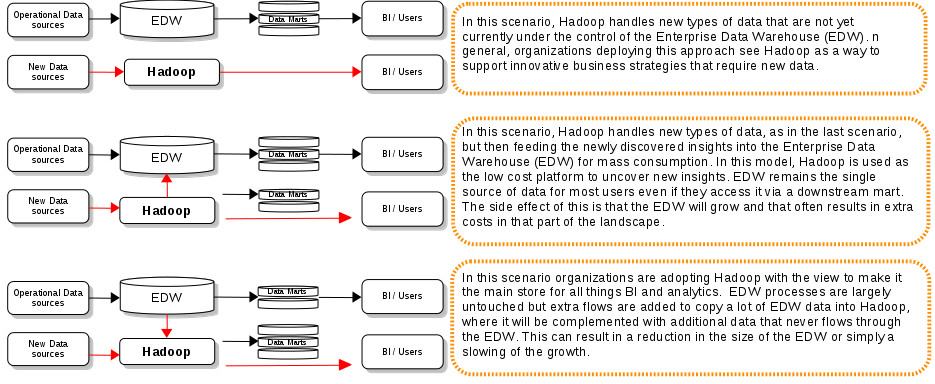
QT – Data Warehouse and Big Data
Teradata, IBM Cognos, MicroStrategy, SAP NetWeaver Business Warehouse, Tableau Software (visual intelligence), QlikView (visual intelligence), Microsoft SQL Data Warehouse (Azure), Amazon RedShift (cloud version of ParAccel Data Warehouse technology). A huge plethora of data warehouse vendors have consolidated Enterprise Data Warehouse (EDW) solutions that are mature and extremely effective for reporting and data analytics.
With the new era of Big Data ecosystem around Hadoop, many people are proclaiming the use of Hadoop as a EDW system to replace proprietary solutions. However the level of maturity of open source Big Data ecosystem is far away from the proprietary EDW solutions in the market.
Taking into account the current level of maturity of Hadoop technologies and company necessities around Data Warehouse, we can observe three scenarios of Hadoop adoption regarding Data Warehouse.
QT – Data Virtualization
As we have mentioned in the last section, the the big data industry still lacks a consensus query-virtualization approach. Today’s Big Data developers must wrangle with a plethora of SQL-like languages for big data access, query and manipulation.
The architectural centerpiece of this new big data landscape must be a standard query-virtualization or abstraction layer that supports transparent SQL access to any and all back-end platforms: Hadoop and non-Hadoop platforms.
Big Data solution providers absolutely must allow SQL developers to transparently tap into the full range of big data platforms, current and future, without modifying their code.
Tools for data virtualization (sometimes data federation) are key actors in this scope. Data virtualization integrates data from disparate sources, locations and formats, without replicating the data, to create a single “virtual” data layer that delivers unified data services to support multiple applications and users. The result is faster access to all data, less replication and cost, more agility to change and standarization. This approach is a must in the most of Big Data proyects.
The View Tier
 In an end-to-end Big Data project, the view tier, the data visualization layer often is the thermometer that measures the success of the project. This is the entry point for our CEOs, CIOs, CTOs, this is the where the data value is perceived by the user.
While it’s designed for handling and storing large volumes of data, Hadoop (and other tools) has no built in provisions for data visualization and information distribution, leaving no way to make that data easily consumable by end business users.
While basic data visualization tools can help users extract, format, and display data for individual consumption, organizations that need to empower a large number of users with information stored in Hadoop need a powerful analytics tool.
VT – Visualization Tools
There aren’t many open source project based on full featured suits. However there are many graphics libraries with powerful visualization capabilties (so development oriented). The following is a list of consolidate suits:
| Eclipse BIRT | The Business Intelligence and Reporting Tools (BIRT) Project is a top-level software project within the Eclipse Foundation. BIRT provides reports with personalized analytics with interactive charts, dashboards and scorecards to analyze data quickly and easily and is certified with Hortonworks Data Platform (HDP) |
| Pentaho | Pentaho is a suite of open source Business Intelligence (BI) products. It’s more than a visualization tool, it’s a complete suit for data integration, OLAP services, reporting, and complete ELT work flows Together with these features Pentaho has a friendly and powerful dashboard technology . It’s a technology certificated by Cloudera and Hortonworks. |
| Lumify | Lumify is a complete suit for data visualization, data integration, analytics. In words of creators: “ is specifically designed for investigative work, where you don’t always know exactly what you’re looking for and need to explore the data, searching for relationships and patterns within to draw new insights. All of this is done though a clean, modern, purpose-built web interface. |
| Dashbuilder | It’s powerful web application which allows non-technical users to visually create visual configurations of dashboards with Drag’n’drop. This is the project behind of visualization capabilities available in products such as JBoss BPMS or JBoss Data Virtualization. |
References
The guide of this document have been the books:
Data Just Right: Introduction to Large-Scale Data & Analytics (Addison-Wesley Data & Analytics Series) by Michael Manoochehri (Google BigQuery).
Designing Data-Intensive Applications: The Big Ideas Behind Reliable, Scalable, and Maintainable Systems by Martin Kleppmann (Apache Samza)
The idea behind a stratification by tiers based in the book:
Streaming Data Designing the real-time pipeline by Andrew G. Psaltis
NoSQL classification based on the book:
NoSQL Distilled: A Brief Guide to the Emerging World of Polyglot Persistence by Pramod J. Sadalage and Martin Fowler
SQL query classification based on MapR article:
https://www.mapr.com/why-hadoop/sql-hadoop/sql-hadoop-details
Data warehouse adoptions patterns based on article:
http://blogs.sas.com/content/sascom/2014/10/13/adopting-hadoop-as-a-data-platform/